Jedox platform release 2023.1 simplifies reporting and provides greater control
The Jedox platform 2023.1 release enhances dashboarding through the next generation of Canvas dashboarding capabilities. Creating custom reports and visualizations with easy drag-and-drop functionality makes communicating plans and performance across the organization straightforward. Model and report builders can pin the most important key performance indicators (KPIs) to the top of dashboards. This means management and other stakeholders can analyze and react to near real-time information on their laptop or mobile device, wherever they are. Additionally, new “write-back” controls within the Jedox Add-in for Excel 365 means finance teams can maintain quality control during budgeting, planning, and forecasting data collection.
Highlights included in the 2023.1 release include:
- User interface and experience: drag-and-drop elements to dashboards, pin favorite KPIs to the top of a report or dashboard, search across Workbooks to add elements to dashboards
- Control: splash specific cells in a Cube, multi-select filters to create subsets of data, lock down specific users from writing back to the Cube while still collecting their input
Altogether, the 2023.1 release provides adaptable and integrated tools for global organizations to more easily communicate key insights that drive confident decision-making.
Always-on forecasting and scenarios development requires shareable dashboards that break down silos across the organization
Actionable insights are easier to produce and communicate due to the following Jedox platform enhancements:
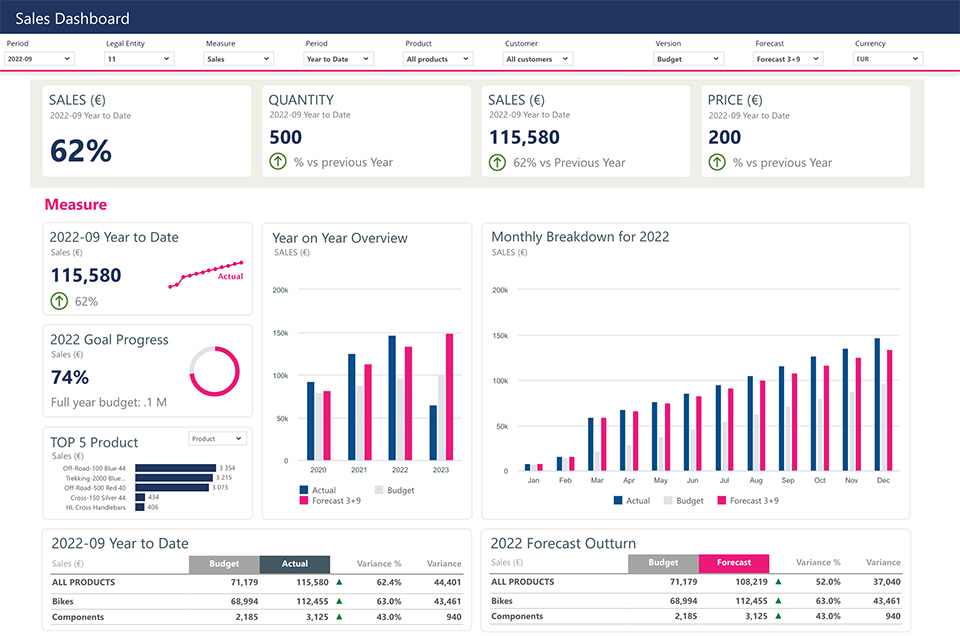
- Drag and drop reports speed up collaboration
- Produce high-impact visualizations driven by all the data that matters. These reports may be shared with management and other stakeholders so they review, analyze, and plan using relevant information.
- Easily retrieve elements to add real-time visualizations to dashboards across all Jedox Cube Workbooks
- Model developers can create dashboard elements in workbooks of their choosing. Developers can browse, select, and drag KPIs, charts, and other elements to where they will make the most impact.
- Dashboard visualizations are updated automatically when underlying workbook data is updated.
- Create subsets of data quickly though multi-select filtering options
- Use any combination of filters to create subsets of data (e.g., Actual 2023 and Budget 2024, but not Budget 2023 and not Actual 2024).
- Use new splashing command to update specific cells in a cube as opposed to updating all data in a Cube
- Update relevant cells (e.g., update only the portions of model associated with employees receiving bonus in 2023).
- Make ETL processes more efficient.
- Control “write-backs” to the model through user-based permissions within the Jedox Add-in for Excel 365
- Prevent bad data entering the Cube by collecting data across the organization through Jedox Add-in for Excel 365 but not allowing every user to write back to the mode. Note: Control of write-back permission extends to users of the Jedox web interface as well.
- Gain greater quality control over operational data, so data remains clean throughout the budgeting and forecasting process.
Example of 2023.1 in action: Adjusting the inflation scenario with data from the latest government inflation report
Imagine a high-performing finance team that practices always-on forecasting and scenario development. They use enterprise data housed in various business systems to support decisions. Ultimately, the team is valued as a business partner for being predictive rather than reactive.
In a hypothetical scenario, monthly inflation data is released by the government showing reduced rates of inflation across a core basket of goods. This is welcome news for everyone, but it also means the team needs to adjust their future-looking scenarios. Their existing model predicts prices for inputs over the next four quarters. One of the inputs to the model is historical price information. This information comes from a wide range of business systems. They previously built Jedox workflows to use a bi-weekly extract, transform, load (ETL) process to drive dashboards for management to evaluate variance in prices from the plan. They then also use this historical data to drive predictions.
Utilizing new capabilities in 2023.1, updating scenarios for management becomes easier and less prone to human error:
- Dashboards that communicate clearly via desktop browsers and mobile apps are easier to maintain and adapt as new KPIs related to inflation are added. The model developer simply creates the element, drags it to the existing management dashboard, and pins the new KPI at the top so all managers are aware of the most current rates.
- Forecasted prices based on actuals ingested by the ETL process are “splashed” with the latest inflation rate. This updates only the cells in the Cube related to pricing.
- Buyers located within local regions are also asked to predict future prices through a worksheet shared with them via the Jedox Add-in for Excel 365. This worksheet prevents the buyers from “writing back” to the Cube, but empowers them to share their perspective with the finance team back at headquarters.
Ultimately, more accurate predictions are delivered to the business through the rapid refinement of predictive models that include data and drivers from colleagues, business systems, and government statistics.
The 2023.1 release of the Jedox platform continues our commitment to deliver incremental value. If you want to see how Jedox can drive a culture of decisiveness in your organization, and empower you to realize a vision for financial and digital transformation, please request a demo today.


